From Vanity Metrics to Real ROI: Social Media Analytics That Pay
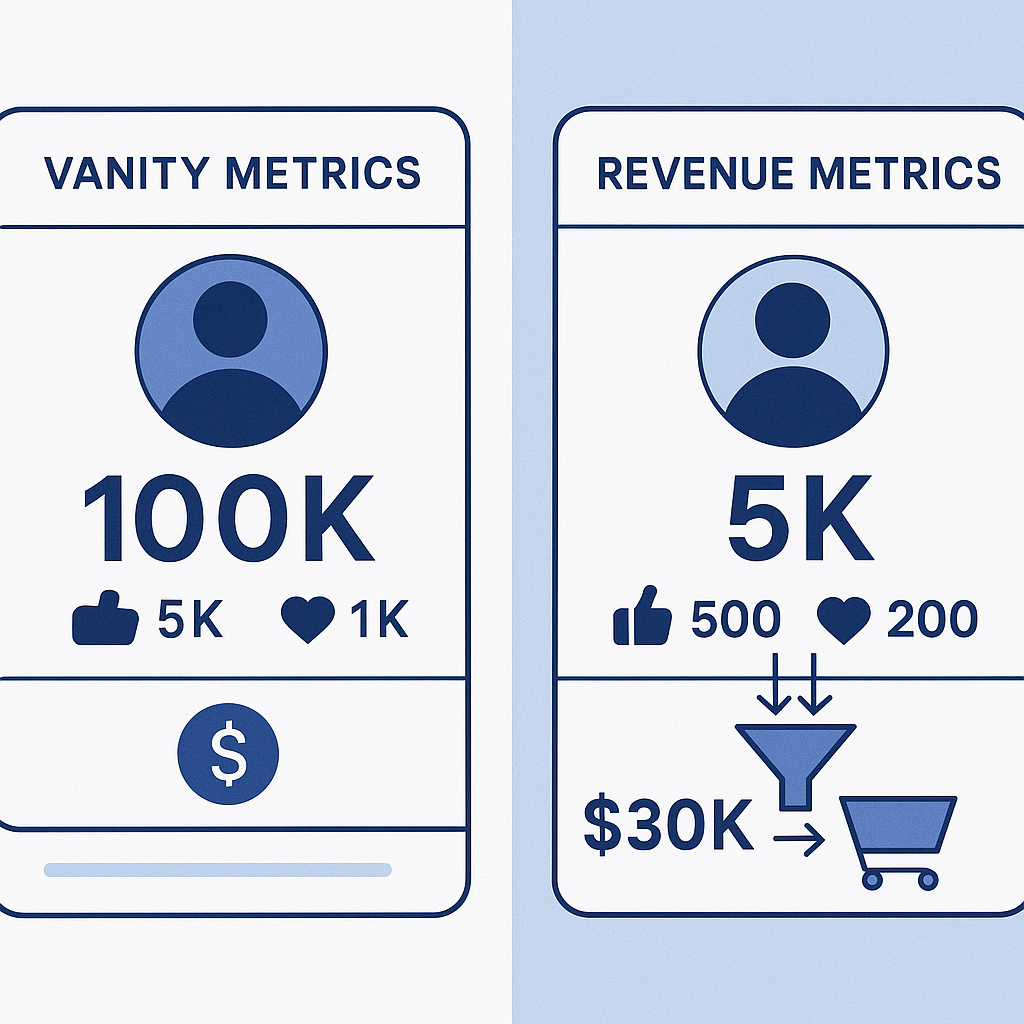
Most affiliate marketers and product creators are drowning in meaningless numbers. Likes, follows, impressions—the holy trinity of social media vanity metrics that make you feel good but don't pay the bills.
I've watched countless marketers obsess over their Instagram engagement rates while their actual revenue flatlines. The harsh truth? Your 50K followers mean nothing if they're not buying.
Here's what separates the profitable social media marketers from the wannabes: they track metrics that directly correlate to cash flow. Not social proof. Not brand awareness. Cold, hard conversions.
The Vanity Metric Trap That's Killing Your Profits
Platform algorithms have trained us to chase the wrong numbers. Instagram rewards engagement. TikTok pushes views. LinkedIn celebrates connections.
But here's the counterintuitive part—what makes platforms happy rarely makes you money.
Take follower count. I've seen affiliate accounts with 200K followers struggle to generate $500/month, while others with 15K highly-targeted followers pull in $8K monthly promoting the same ClickBank health offers. The difference isn't audience size. It's audience quality and tracking precision.
The platforms want you addicted to their vanity metrics because it keeps you posting, engaging, feeding their algorithm. Your actual business goals? Secondary.
Why Engagement Rate Misleads Affiliates
Engagement rate feels important. High engagement suggests an active, interested audience—exactly what you want for affiliate promotions, right?
Wrong.
Engagement measures interaction, not intent. Comments like "Great post!" and "Love this!" inflate your engagement rate but indicate zero purchase intent. Meanwhile, someone who silently clicks your affiliate link and buys generates zero engagement but 100% of your revenue.
I've found the sweet spot for affiliate-focused content often sits around 2-4% engagement rate. Higher than that, and you're likely entertaining more than selling.
The Revenue-First Analytics Framework
Profitable social media marketing starts with working backward from revenue. Not forward from followers.
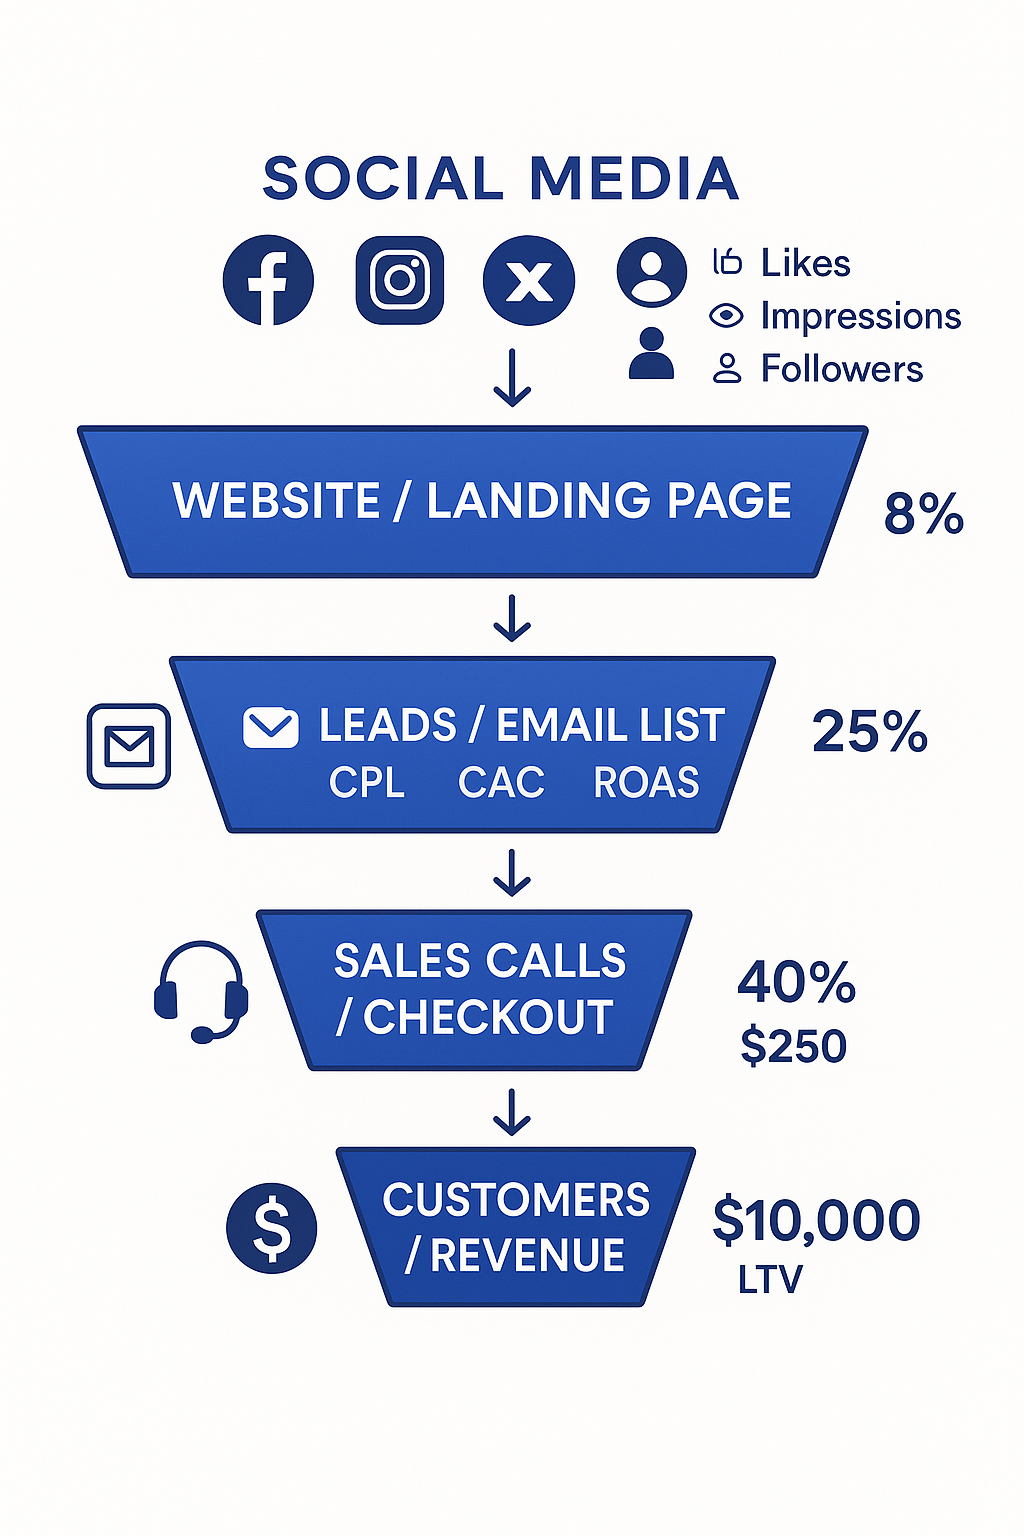
Here's the framework that actually works: Revenue → Conversions → Traffic → Engagement → Reach.
Start with your monthly revenue target. Say you're promoting a $47 course with 50% commissions—you need $4,000 in sales for $2,000 in commissions. That's roughly 85 sales.
If your landing page converts at 3%, you need 2,834 clicks. If 8% of your social traffic clicks through to your landing page, you need 35,425 social media visitors. Now you can reverse-engineer the engagement and reach required.
Click-Through Rate: Your North Star Metric
For affiliates and product creators, click-through rate trumps everything. It's the bridge between social media activity and actual business results.
Track CTR religiously across platforms:
- Instagram Stories: 3-5% is solid, 7%+ is excellent
- TikTok bio link: 1-2% from profile views
- YouTube descriptions: 2-4% from views
- Facebook posts: 0.5-1.5% (organic reach limitations)
But don't just track overall CTR. Segment by content type, posting time, audience source, and promotion style. The patterns will reveal your highest-converting content formats.
Conversion Tracking Beyond the Platform
Social platforms want to keep users on-platform. Their analytics stop at the click—exactly where your business begins.
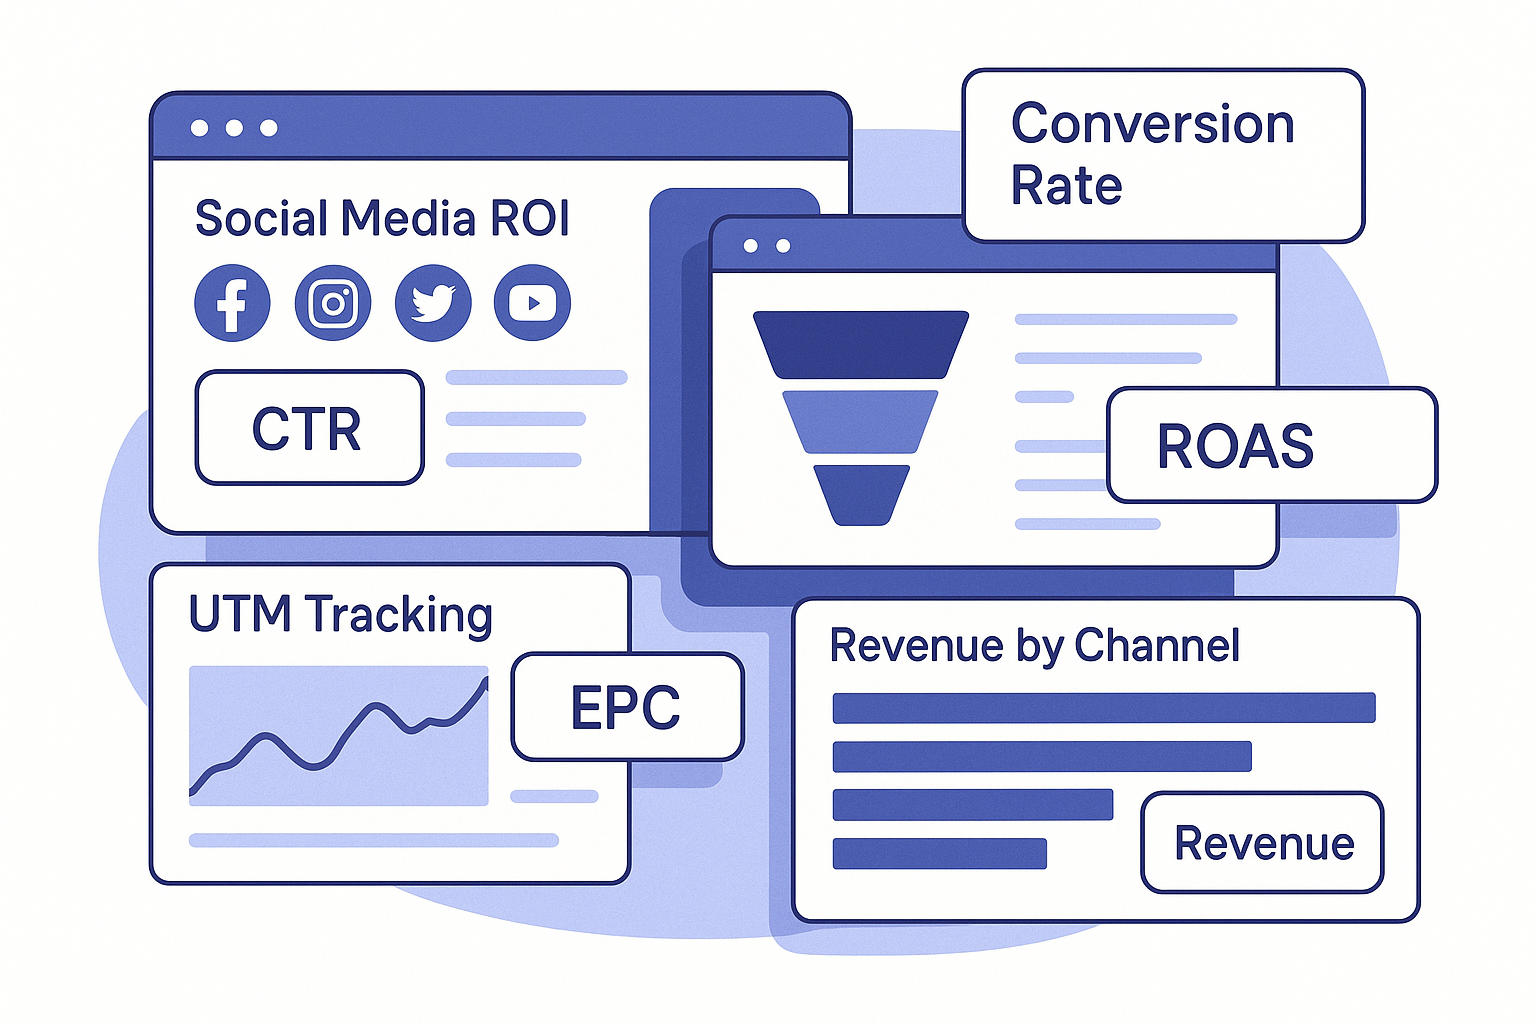
That's why you need external tracking. Google Analytics 4, properly configured with UTM parameters, shows you which social posts drive actual sales. Not just traffic. Sales.
Set up conversion tracking for every step of your funnel:
- Social click to landing page
- Landing page to email capture
- Email subscriber to purchase
- Purchase to upsell/cross-sell
This reveals the complete customer journey, not just the social media portion.
Platform-Specific Revenue Metrics That Matter
Each platform offers unique opportunities for revenue generation—and unique metrics to track success.
Instagram: Beyond Likes and Comments
Instagram's Creator Studio provides business-focused metrics most marketers ignore:
Profile visits per post: Indicates strong enough interest to learn more about you. Track this for posts that mention your offers.
Website clicks: Direct revenue indicator. Sort posts by website clicks to identify your highest-converting content styles.
Story completion rate: For affiliate marketers using story sequences to warm up audiences before pitching, completion rate predicts conversion better than story views.
The real Instagram goldmine? DM automation tools like ManyChat integrated with your Instagram Business account. Track DM-to-sale conversion rates—often 10-20x higher than bio link conversions.
TikTok: The Sleeper Platform for Affiliates
TikTok's Creator Fund metrics miss the revenue picture entirely. Focus on these instead:
Profile visit rate: Views-to-profile-visits ratio indicates how compelling your content is. Aim for 2-3% minimum.
Hashtag performance: Track which hashtags drive profile visits, not just views. Revenue-driving hashtags often differ from viral hashtags.
Video completion rate: TikTok shows this in your analytics. Videos with 70%+ completion rates typically drive more profile visits and bio clicks.
Pro tip: TikTok users research before buying. Your bio link might get clicked days after someone watches your video. Use longer attribution windows (7-14 days) in your tracking.
YouTube: The Long-Term Revenue Engine
YouTube's revenue potential extends far beyond ad revenue sharing. For affiliates and course creators, focus on:
Watch time per subscriber: High watch time indicates engaged audience likely to trust your recommendations.
End screen click-through rate: Often higher than description link CTR. Use end screens to drive traffic to opt-in pages, not direct affiliate links.
Comment sentiment analysis: YouTube comments reveal purchase intent better than other platforms. Look for questions about pricing, availability, alternatives—buying signals disguised as engagement.
Advanced Attribution: Tracking the Untraceable
Social media attribution gets messy. Someone sees your Instagram post, researches on Google, signs up for your email list, then buys three weeks later after a promotional email.
Standard analytics credits the email. But Instagram started the journey.
Here's how sophisticated marketers solve this:
UTM Parameter Strategies
Create unique UTM codes for every significant social media push:
- utm_source=instagram
- utm_medium=story
- utm_campaign=blackfriday2026
- utm_content=testimonial_video
But go deeper. Use custom UTM parameters to track specific post types, audience segments, even posting times. This granular data reveals patterns invisible in platform analytics.
Customer Journey Mapping
Survey your customers. Ask how they first discovered you. The answers often surprise you.
I've found that customers frequently misremember their discovery path, but patterns emerge. If 40% mention "TikTok" and 25% say "Google," but your Google Analytics shows opposite proportions, TikTok's influence extends beyond direct attribution.
Tools and Systems for Revenue-Focused Social Analytics
The right tools make revenue tracking manageable instead of overwhelming.
Essential Analytics Stack
Google Analytics 4: Non-negotiable for conversion tracking. Set up Enhanced Ecommerce if you're selling products directly.
Triple Whale or Northbeam: For serious e-commerce creators, these tools provide advanced attribution modeling that connects social media touches to revenue.
ConvertKit or ActiveCampaign: Email platforms with robust tagging systems let you track which social sources generate the most valuable subscribers.
Bitly or Pretty Links: Link shortening with click analytics. Essential for tracking bio links and story links across platforms.
Custom Tracking Solutions
For high-volume affiliates, custom tracking pays off. Simple Google Sheets automation can track:
- Daily social media clicks by platform
- Weekly conversion rates by traffic source
- Monthly revenue attribution
- Content performance correlation
The key is consistency. Daily data entry beats elaborate systems used sporadically.
Making Data-Driven Content Decisions
Revenue-focused analytics should drive content strategy, not just measure it.
Review your data weekly, not daily. Look for patterns across 7-14 day periods:
Which content formats drive the most clicks? Educational posts might get more engagement, but promotional content might convert better.
What posting times correlate with highest revenue? This varies dramatically by niche and audience.
Which calls-to-action work best? "Link in bio" vs "DM me for details" vs "Comment 'READY'" can show massive performance differences.
The goal isn't perfect data. It's actionable insights that increase revenue month over month.
Social media analytics in 2026 will become even more privacy-focused, making first-party data collection crucial. The marketers who build robust tracking systems now—focused on revenue rather than vanity metrics—will thrive as platform analytics become more limited.
Start tracking what matters: clicks, conversions, and cash. Everything else is just noise.
This article contains affiliate links. We may earn a commission at no extra cost to you. Full disclosure.
Editorial Team
Senior Digital Marketing Strategist
The Prophet Visionary editorial team covers affiliate marketing, paid traffic, funnels, and digital product strategy with hands-on practitioner experience.
Learn more about our editorial team →Turn Social Followers Into Subscribers You Own
Social reach is rented. Email subscribers are yours. AWeber gives you landing pages, sign-up forms, and automated sequences to convert social engagement into revenue.
See How AWeber ConvertsThis page contains affiliate links — I may earn a commission at no extra cost to you.
Disclaimer: The information on this site is for educational purposes only and does not constitute financial, legal, or business advice. Results vary based on individual effort, market conditions, and other factors. Always do your own due diligence before making business or investment decisions.